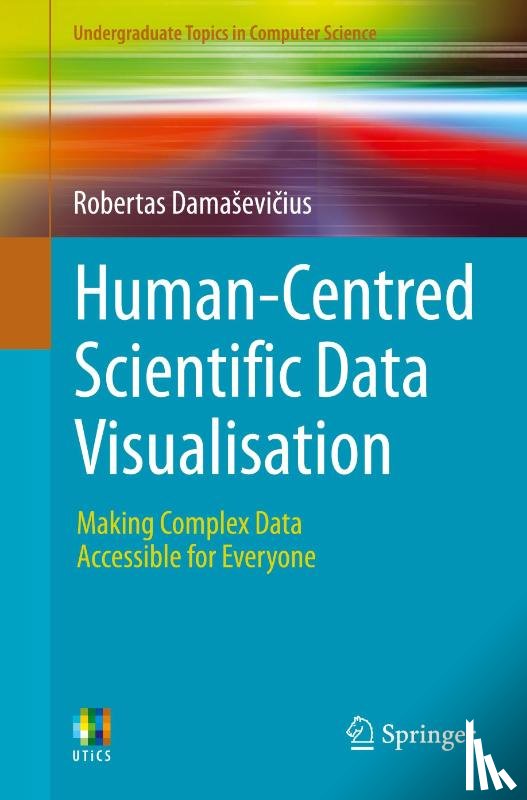
Covering a wide range of chart types—including line plots, bar charts, box plots, scatterplots, histograms, pie and donut charts, spider plots, ridgeline plots, density plots, and advanced visualizations like treemaps, network graphs, and Sankey diagrams, it blends visualization theory with hands-on implementation in Python and R.
I have a question about the book:
'Human-Centred Scientific Data Visualisation - Damasevicius, Robertas'.
Fill in the form below.
We will respond as fast as possible.
We value your privacy
We use cookies to measure traffic, improve Boekstra and let Google tailor ads to your interests. You can keep using the site either way — even if you decline. More info