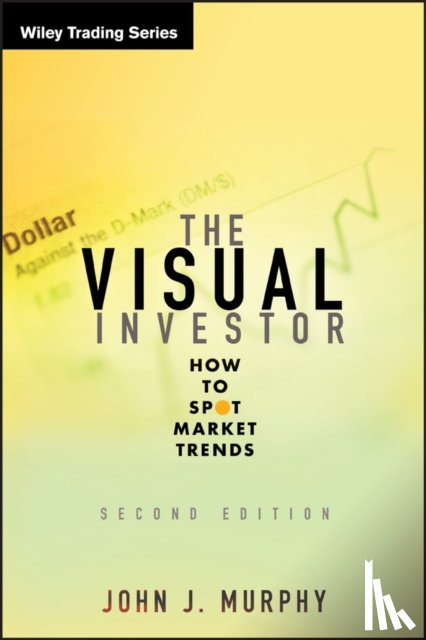
The Visual Investor, Second Edition breaks down technical analysis into terms that are accessible to even individual investors. Shows investors how to follow the ups and downs of stock prices by visually comparing the charts, without using formulas or having a necessarily advanced understanding of technical analysis math and jargon.
I have a question about the book:
'The Visual Investor - Murphy, John J. (Fordham University'.
Fill in the form below.
We will respond as fast as possible.
We value your privacy
We use cookies to measure traffic, improve Boekstra and let Google tailor ads to your interests. You can keep using the site either way — even if you decline. More info