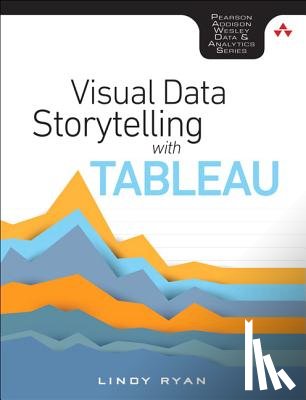
The modules in this book will go beyond the dashboard to communicate business-relevant implications of data analyses using the analytic, visualization, and storytelling capabilities of Tableau, the most popular visualization software in use by businesses world today. Each chapter will split focus between discussing key components of design practice and data visualization and introducing a format for representing information with step-by-step guides for using Tableau. By the end of this book, readers will not only understand how data stories differ from traditional storytelling and how to purposefully craft a compelling data story, but also how to employ the horsepower of Tableau to structure data analysis projects so that they can effectively analyze, visualize, and communicate insights in a way that is meaningful for stakeholders across a variety of communication mediums.
I have a question about the book:
'Visual Data Storytelling with Tableau - Ryan, Lindy'.
Fill in the form below.
We will respond as fast as possible.
We value your privacy
We use cookies to measure traffic, improve Boekstra and let Google tailor ads to your interests. You can keep using the site either way — even if you decline. More info