Best practices for creating effective charts and information graphics in Microsoft Excel
Description
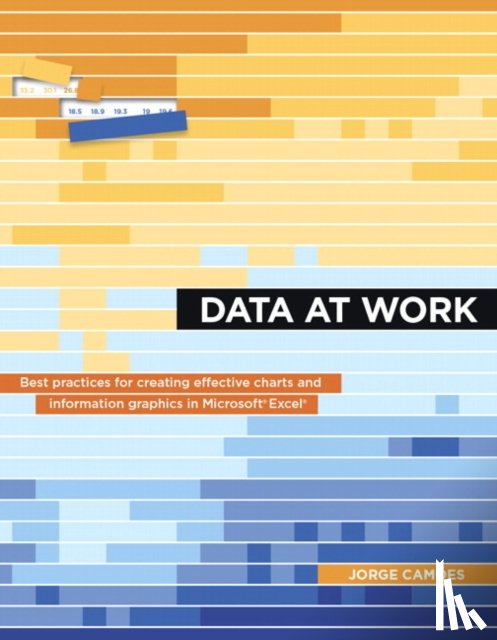
Data at Work will help students to know which type of chart to use and how to format it, regardless of which spreadsheet application they use and whether or not they have any design experience. In this book, they'll learn how to extract, clean, and transform data; sort data points to identify patterns and detect outliers; and understand how and when to use a variety of data visualizations including bar charts, slope charts, strip charts, scatterplots, bubble charts, boxplots, and more. Because this book is not a manual, it never specifies the steps required to make a chart, but the relevant charts will be available online for students to download, with brief explanations of how they were created.
I have a question about the book:
'Data at Work - Camoes, Jorge'.
Fill in the form below.
We will respond as fast as possible.
We value your privacy
We use cookies to measure traffic, improve Boekstra and let Google tailor ads to your interests. You can keep using the site either way — even if you decline. More info